Release 3.1
The final software release for 3.1 is available for download!
Version 3.1 comes with a fresh and new interface, new flexible report and dashboard layout possibilities, two web-based report editors for both experts and novice users, a new template based export engine and much much more…
Continue reading for an updated overview of the new features and the release notes.
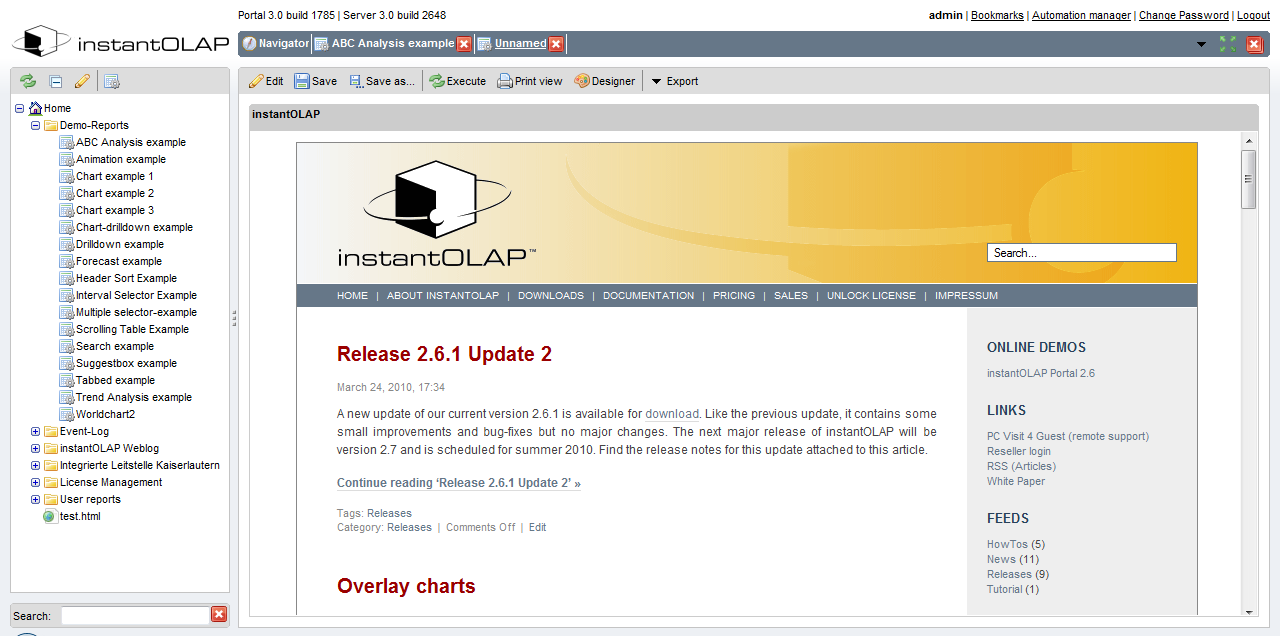
We cleaned up and gave instantOLAP 3 a fresher and clearer design with less buttons and tabulators but more functionality. Not much to write here, just have a look onto the following screenshots.
The Designers
instantOLAP 3 allows to interactivly change content and the look&feel of your reports while watching them. A couple of new “designers” can be opened while watching a report, including a designer for the pivot-table content, a designer for the table-layout, a designer for charts and others.
Query Designer
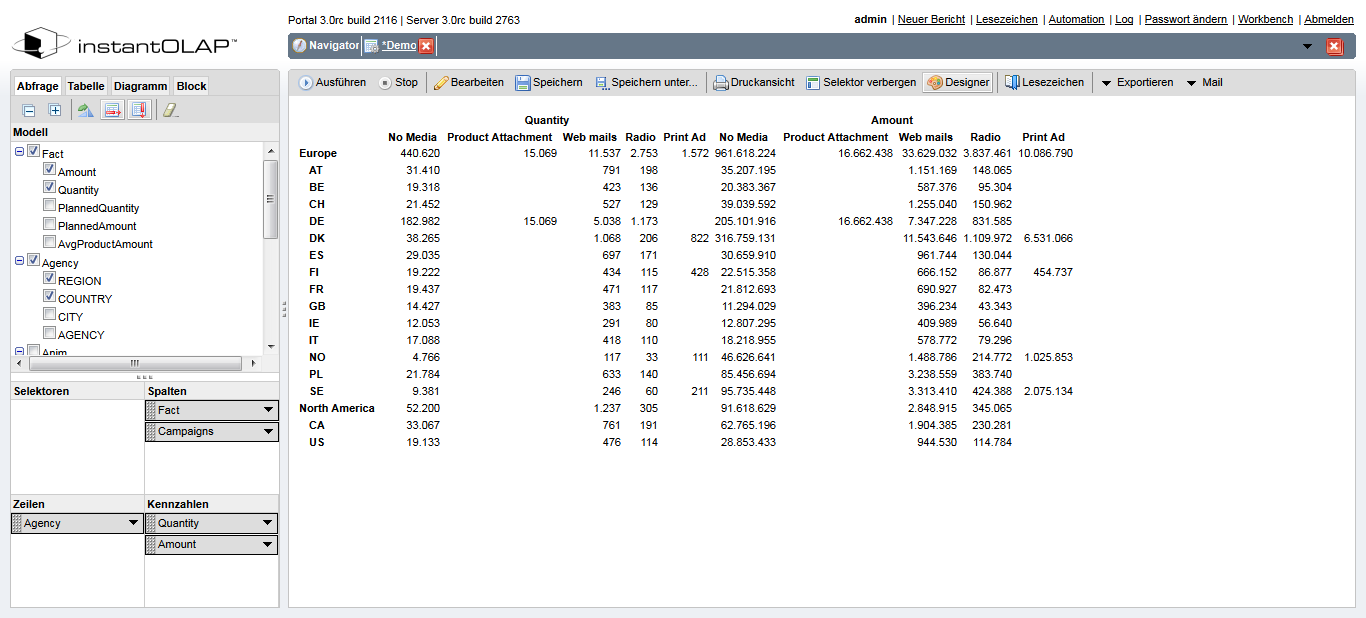
The Query Designer allows to add axes, facts and selectors to your report with single mouse clicks. You can also rearrange your reports, add Top 10 filters and do many things more inside the designer without having any knowledge of instantOLAP queries.
Table Designer
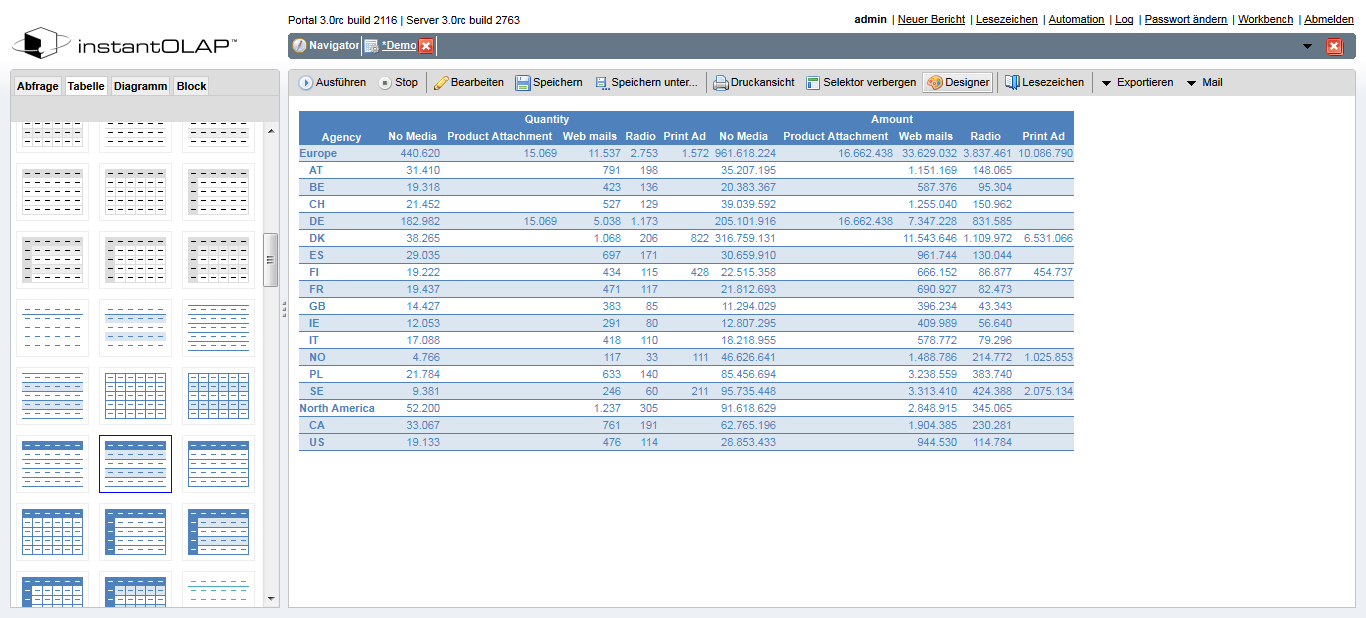
The Table Designer offers a large number of predefined table designs. Simply change the look & feel of your report by selecting one of them. Of course, after you selected on the designs, you can change it afterwards by changing the table properties.
Block Designer
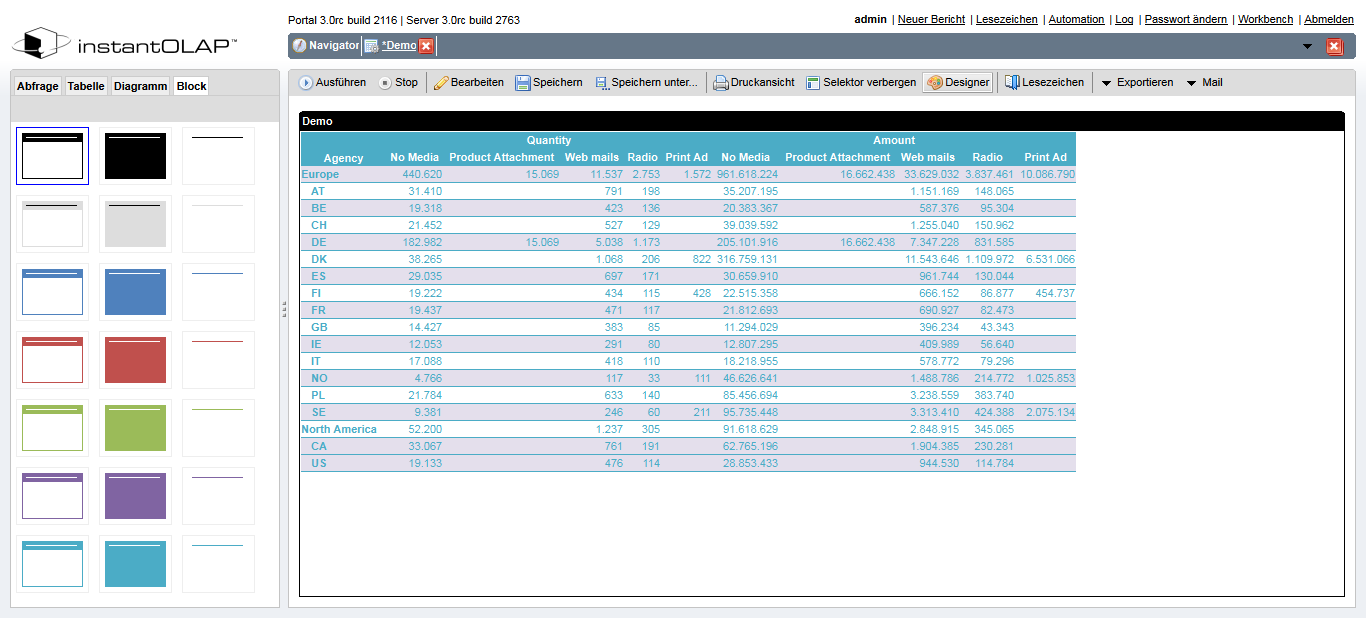
The Block Designer is very similar to the Table Designer but changes the look & feel of the containing blocks. Like the Table Designer, it offers a number of predefined layouts where you can choose from.
Chart Designer
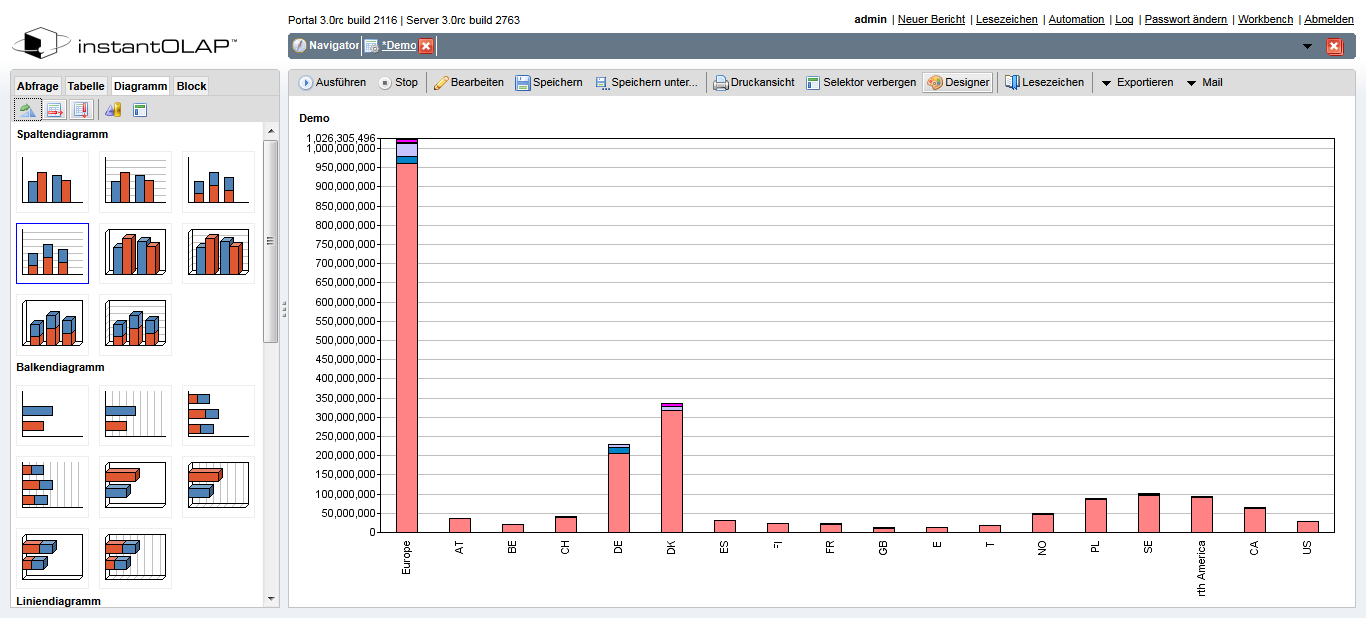
Another very useful is the Chart Designer. It automatically turns your query into one of the predefined charts. A large number of chart layout are offered, including 3D versions of every available chart type.
Better layout possibilities for queries
A more flexible block layout
First of all, we broke the fixed block structure of queries and created a new, more flexible alternative. Now you can nest as much blocks as you want and as deep as you want. E.g. it is possible now to nest complete reports in tabulator block and to build huge executive reports which contain all neccesary data in one page.
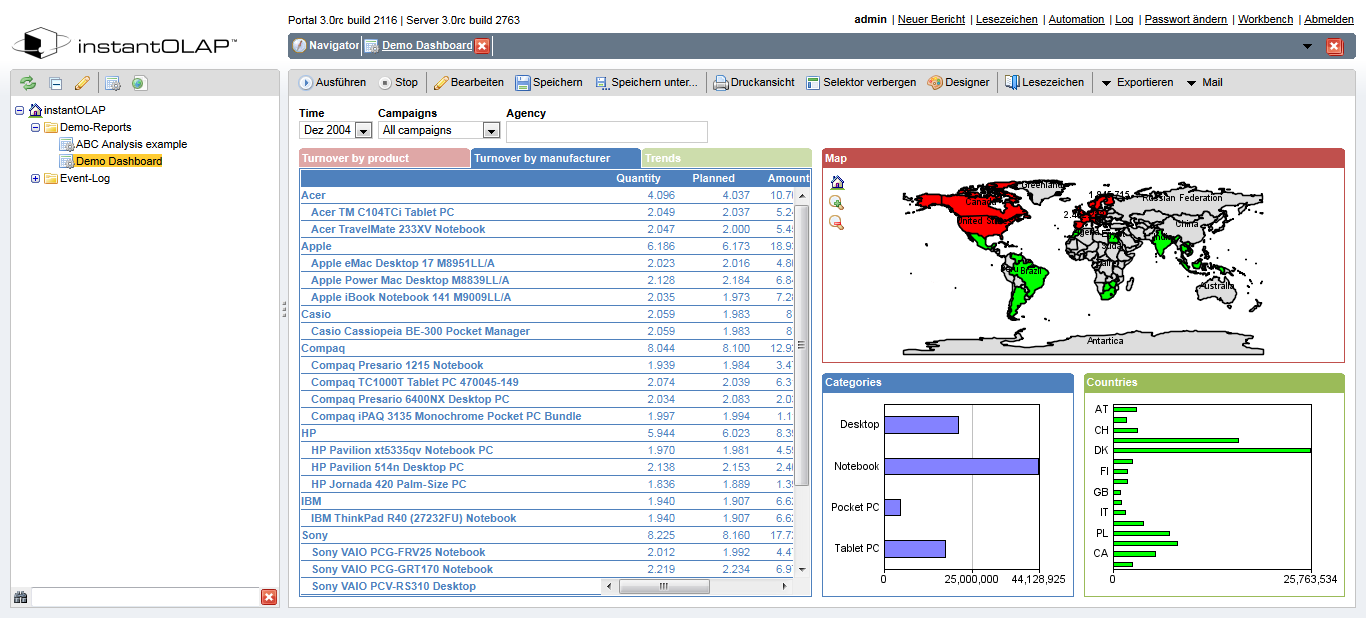
Also, the selectors are no longer limited to stay at the top of the query, they can also be placed in any other block and every block can have its own selector. You may even place the selector at the left, right or bottom border of your blocks.
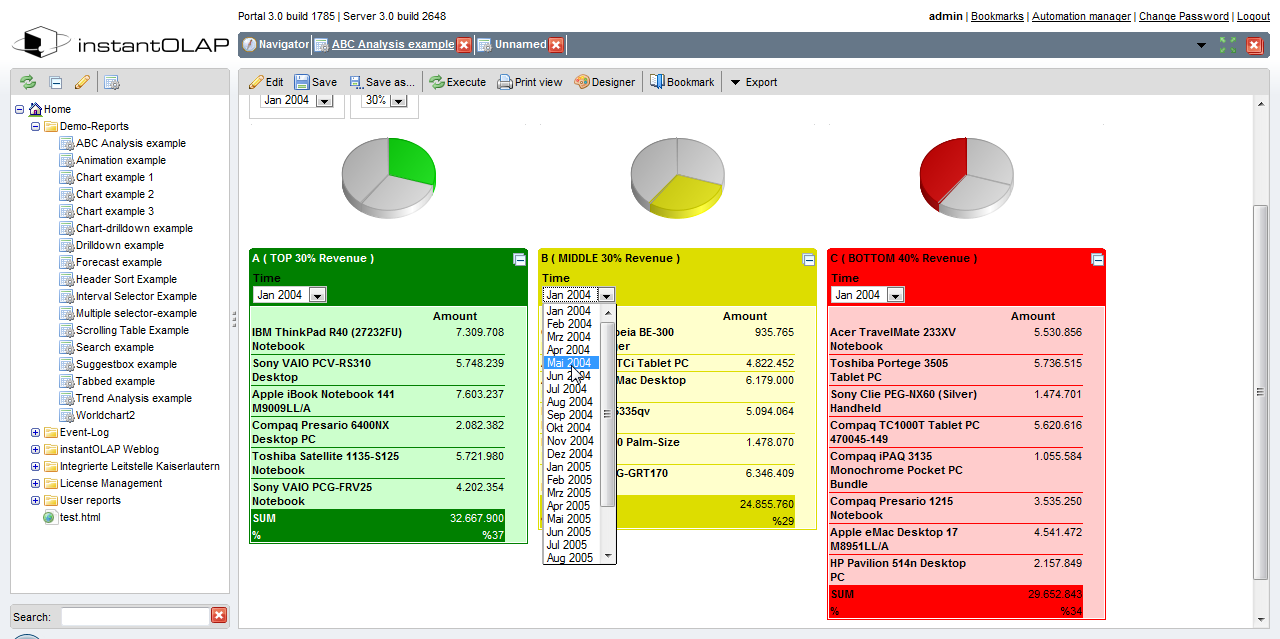
Of course, the old query structure will automatically converted in the current one and every existing query will be compatible with version 3.
New “Fit To Screen” mode
The new option “Fit To Screen” for reports lets them use the whole available space on the screen. This is very nice e.g. for building dashboards.
All blocks will be displayed inside the screen without the need to scroll the report in order to see blocks outside the screen. If you enlarge browser window, all blocks will be enlarged immediately, too.
Because in this mode the content of the blocks can be larger than the block itself, all tables will automatically display as scrollable tables with fixed headers. Images and maps will be zoomed to the size of their block. All other content like IFrames or commets will be displayed with scroll bars if the content is too large.
New block types
We also introduced two new block types, the “IFrames” and “Query-Imports”. IFrames allow to display other HTML pages within your reports and to enrich them with other content. Query-Imports display other queries inside the importing query as if they were part of it itself.
And – you can include other queries as a block by using the “Query Import” format. This allows to reuse and to build dashboards by putting multiple queries together!
Partitial loading of queries
Another great change is how the queries load their content: Until now, every query was executed and displayed as a monolithic block, but now every block can update its content without the need to refresh other blocks. E.g. drilldown inside a table can become much more comfortable, because only the block containing the table has to be refreshed.
Also, blocks now do not load their content until it is needed. E.g. tabbed blocks will only load the data of their visible tab and dynamically load the other tabs content when the user selects them. Additionally, blocks can be collapsed and only load their data when the user expands them. This allows to build fast dashboards which load their data only on demand.
Use multiple models or single cubes in one query
A much requested feature was to use multiple models in a single query. In instantOALP 3, each query can use a different model and you can generate reports with data from multiple models. Even the selectors work with different models if the dimensions have the same name. The only limit is that a single table or chart may only use a single model.
Included fully functional Query Editor
This is surely one of the greatest features in instantOLAP 3: This version will contain a fully functional and powerful query editor, even more mighty than the editor included in the Workbench of previous versions.
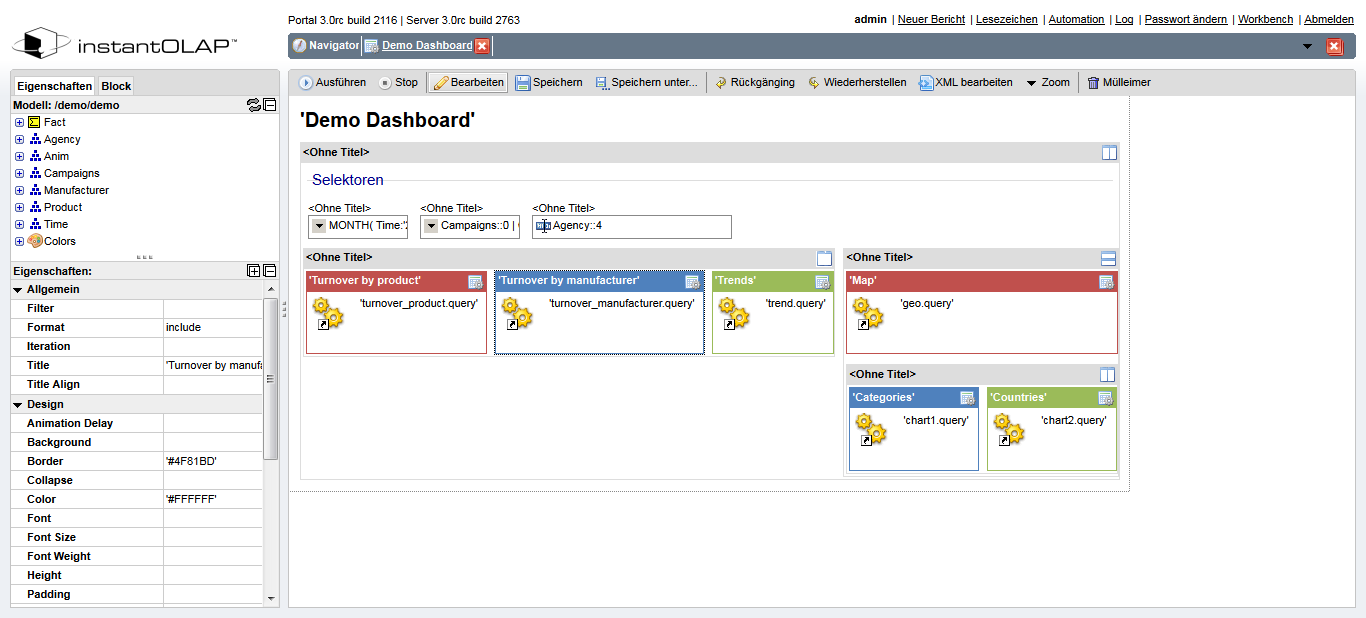
The new editor used the same layout and look & feel like the Workbench version – including drag & drop – but contains a couple of new improvements:
- First of all, it reflects the new block structure, this means you can nest blocks as you want and create selectors everywhere. A large number of new context menus will help you to arrange blocks and to change their format.
- Also, the new Designers from the Query Viewer are available in the editor. This means, you can also design tables or turn them into predefined charts within the editor with a few mouse clicks.
- The property editor has the same functionality as the Workbench version. Properties are now group in the web front end and Workbench.
- The query editor will use the powerful expression editor of the portal which allows a much more powerful editing of expressions, including Top 10 requests, dimension searches, saved expressions and much more. We also improved the expression editor between version 2.7 to version 3.
- A zoom function allows to keep the whole report in sight when editing large reports.
In difference to our first planning, the Workbench still contains the query editor (now compatible with the new query structure).
New export engine
DOC export
With the final version 3, we changed the export engine for PDF exports and added the new DOC export (compatible with MS Word). Both export formats use the same engine.
Export templates
The new export format is based on document templates (either MS Word or Open Office format). instantOLAP uses this templates as the base for exports and appends the report content to them. Templates can contain images, headers, footers, an index, fields and anything else. Some report informations (like the name, title or author) are passed to the template as fields and can be used anywhere in the exported documents.
Each report can use its own template – the new property “Export Template” allows to specify the template for a report.
By default, instantOLAP comes with three predefined templates, a “normal” template (DIN A4), a template with index and a landscape version. All templates contain the instantOLAP logo which can be easily replaced with your company logo. All default templates are placed in the folder “stylesheets” inside the repository.
Because the size and orientation of the document is now defined by the template, all export properties for the size have been removed (Print Width and Print Height). Also, the logo is now defined by the template and not by the report itself. Therefore, the “Print Logo” property has been removed from the report and folder properties.
Export layout
By default, reports are now exported without the original block layout of the report and all blocks are exported below each other. Because reports can contain many nested block since version 3, this is necessary in order to keep the exported documents readable.
With the new export property “Keep Block Layout”, you can force a report to export it block with nearly the same block layout as the screen version – e.g. images will be placed next to tables etc.
Release notes
These release notes only contain the differences between the final version and the release candidate. To see all differences between 2.7 and 3.0, you should also read the release notes of 3.0 RC.
Web-Frontend
- Browser support for Internet Explorer 9 and Firefox 4/5 added
- Better compability with Safari browser (resizing the repository, restoring the scrollposition when switching between reports etc)
- Better compability with Internet Explorer 7 and 8
- New export format (Microsoft DOC format) added. The new format uses DOT templates, which can be changed or extended by the customer. Also, the PDF export now uses the same technology and is just a PDF output of the DOC export. Because of the templates, the page size and export label properties for reports have been deleted.
- Improved import of 2.x reports (importing border colors and block aligns)
- The repository search now also searches in the description of reports
- XML export can now be enabled / disabled with the new property “Enable XML export”
- Permalink option added to export menu
- Invisible cells are not exported to charts
- Bugifx: Targets for chart links were ignored
Server
- New function GETDAYOFWEEK was added
- Less memory usage for large reports
- Concurrent license codes can be assigned to user names now
- Better compability with the newer versions of the Tomcat server (newer Tomcats can change the JSESSION id of a running session at any time)
Workbench
- Reports and Configurations can be opened in “Read only” mode, even if the file is currently locked by another user
