We would like to take this opportunity to thank you for the extremely positive feedback from our live presentation of the CANTOR BI module based on instantOLAP.
The USB sticks with a complete instantOLAP system including demo data, which can be run directly from the USB stick, have enjoyed great popularity. You can also simply copy the files from the stick to the hard disk of any PC or server and start them from there. No installation is necessary! In addition, there is a mini version of the model presented on the stick.
A short guide to creating your own report with your data:
Based on this model, we have copied the finished reports: order overview and order detail view into the demo directory.
Never before have you created a report so easily and quickly!
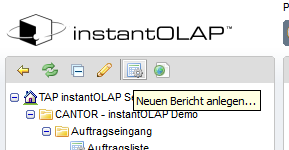
When you log on to the browser as admin/admin, you can create pivot tables or graphics. To do this, select the Pivot Report button in the upper left corner of the screen…
and choose the cantor_demo model.
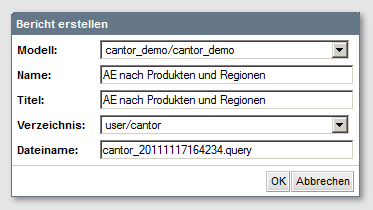
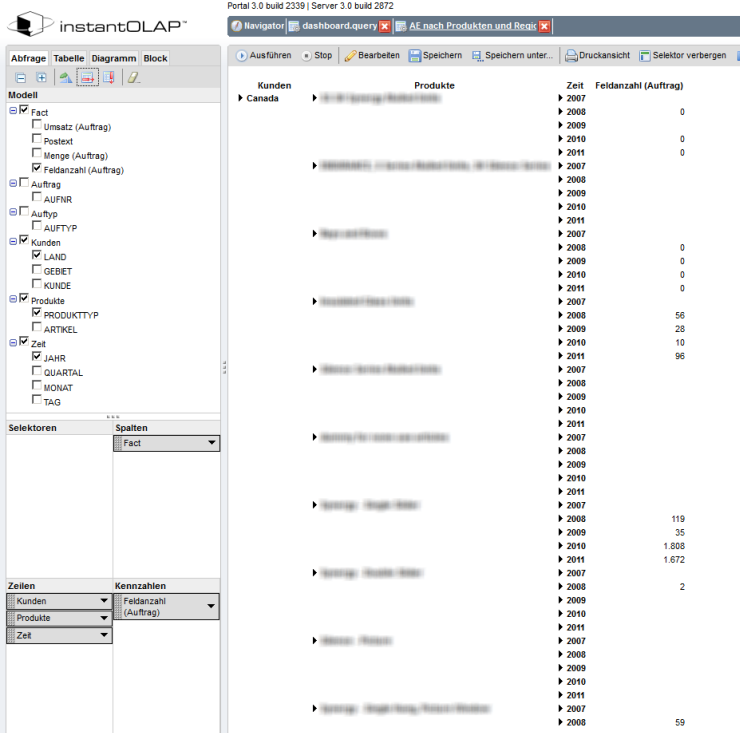
Then simply click on the desired facts and dimensions and your drilldown-compatible order overview by products, years and regions is ready:
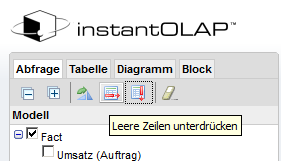
You can also suppress the blank rows:
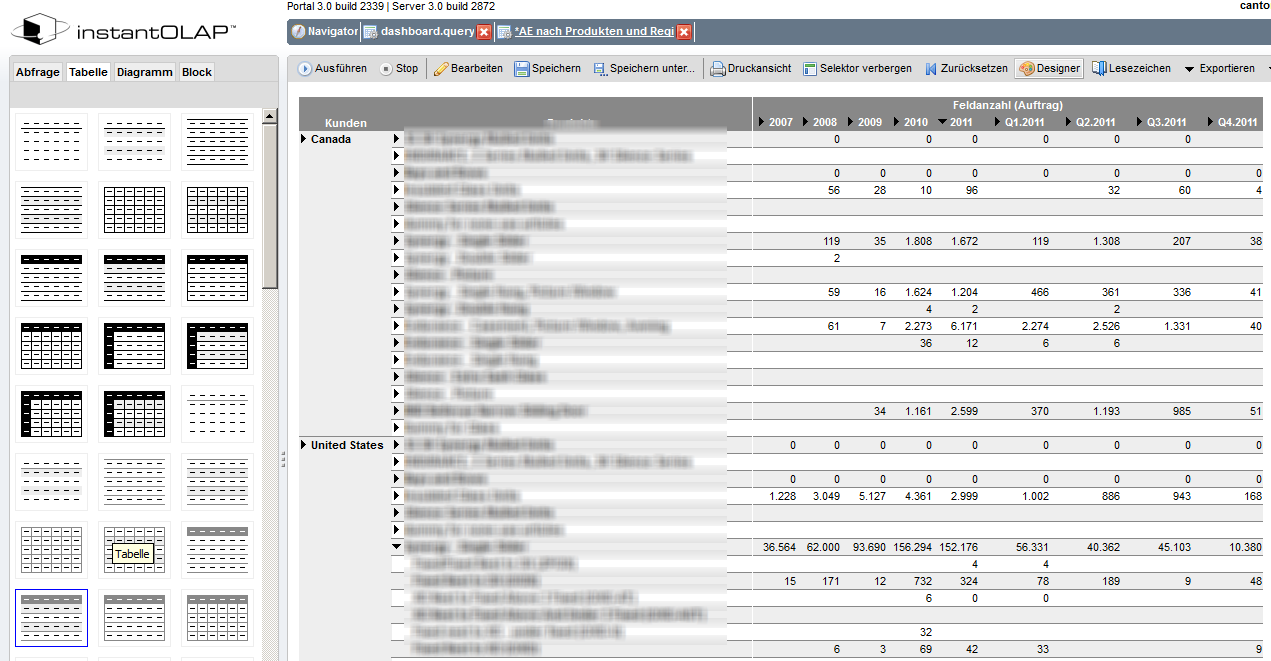
then move the time dimensions to the columns, select a nice layout and you’re done with your fully interactive report!
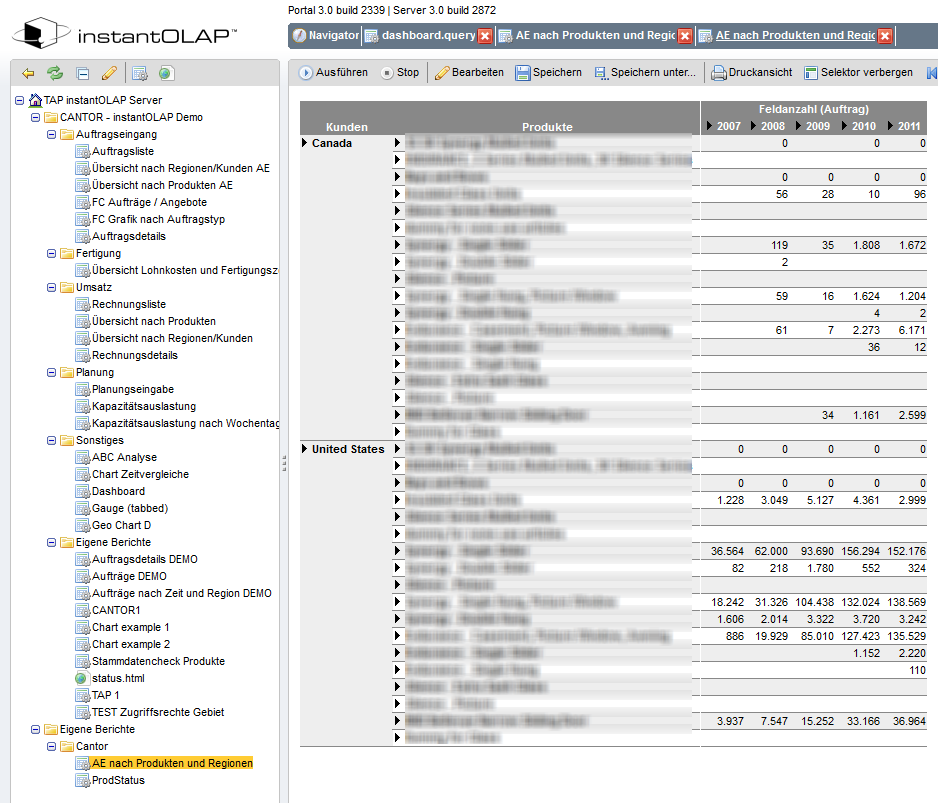
Save and let the colleagues marvel 🙂
The presentation foils : TAP_CANTOR_LIVE and the instantOLAP CANTOR Flyer
